
Ethereum price failed to stay above $3.000 still refused. ETH is now consolidating and could soon target the start of a recovery wave if it breaks above $2880.
- Ethereum started a new decline below the USD 2950 zone.
- The price is moving below $2,900 and the 100-hour simple moving average.
- There is a connecting bearish trend line forming with resistance at $2920 on the hourly chart of ETH/USD (data via Kraken).
- The pair could continue to move downwards if it breaks below the $2800 zone.
Ethereum price drops to new weekly lows
The price of Ethereum tried to rise again, but struggled above $3000, like Bitcoin. The price of ETH dropped below $2950 and $2920 and entered the bearish zone.
The bears even pushed the price below $2,850. A low was formed at $2,790 and the price is now consolidating losses well below the 23.6% Fib retracement level of the downside move of $3,175 to the $2,790 low.
The Ethereum price is now trading below $2,900 and the 100-hour simple moving average. Additionally, there is a connecting bearish trendline forming with resistance at $2920 on the hourly chart of ETH/USD.
If there is another move up, the price could face resistance near the $2,880 level. The next key resistance is near the $2920 level and the trend line. The first major resistance is near the $2980 level and the 50% Fib retracement level of the downward move from the $3175 swing high to $2790 low.
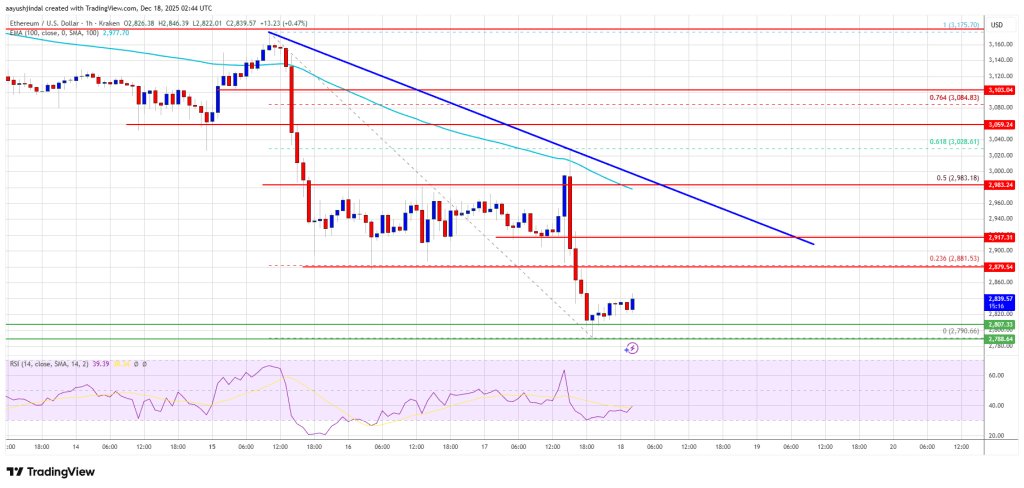
A clear move above the $2980 resistance could send the price towards the $3030 resistance. An upside break above the $3030 region could claim more gains in the coming days. In the said case, Ether could rise towards the resistance zone of $3120 or even $3150 in the near future.
Another ETH crash?
If Ethereum fails to overcome the $2,880 resistance, a new decline could begin. Initial support on the downside is near the $2,800 level. The first major support is located near the $2780 zone.
A clear move below the $2780 support could push the price towards the $2740 support. Any further losses could take the price to the $2625 region. The next key support is at $2,550.
Technical indicators
Hourly MACD – MACD for ETH/USD is gaining momentum in the bearish zone.
Hourly RSI – The RSI for ETH/USD is now below the 50 zone.
Major support level – $2780
Main resistance level – 2920 USD


