
Bitcoin price fell further and traded below the $87,000 support zone. BTC is now consolidating and may struggle to break the $89,350 zone.
- Bitcoin started a new decline below the $87,500 zone.
- The price is moving below $88,000 and the 100-hour simple moving average.
- There is a bearish trend line forming with resistance at $88,500 on the hourly chart of the BTC/USD pair (data from Kraken).
- The pair could continue to rise if it breaks above the $89,350 zone.
Bitcoin price consolidates losses
Bitcoin price struggled to stay above the $89,000 and $88,500 levels. BTC started a new decline and was trading below the $88,000 support.
The price even jumped below the $86,500 support. However, the bulls were active near the $85,000 zone. The low was formed at $85,151 and the price recently started an upward correction. There was a move above the 23.6% Fib retracement level from the $93,560 move down to the $85,151 low.
Bears are active near $89,000. Bitcoin is now trading below $88,000 and the 100-hour simple moving average. If the bulls remain in action, the price may try to rise further. Current resistance is near the $88,000 level. The first key resistance is near the $88,500 level. A bearish trend line is also forming with resistance at $88,500 on the hourly chart of the BTC/USD pair.
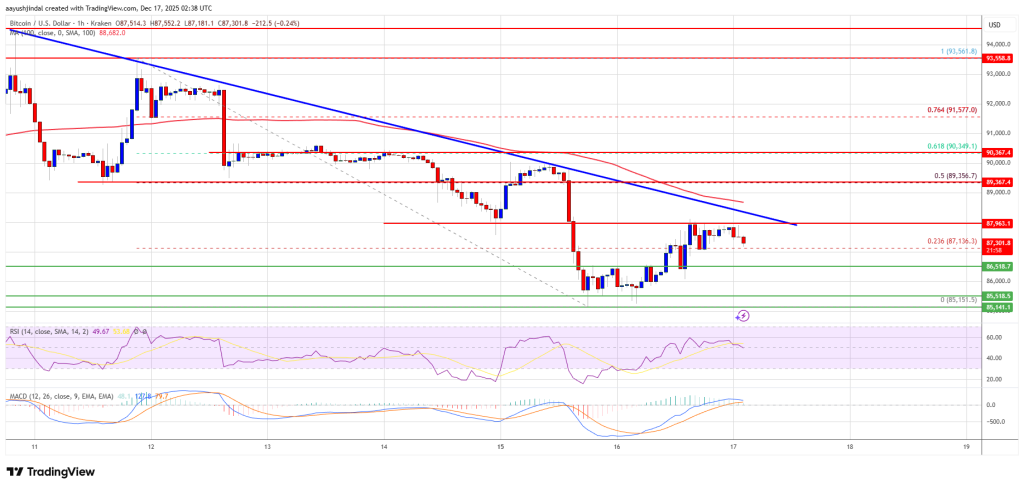
The next resistance could be $89,350 or the 50% Fib retracement level of the $93,560 downtrend to the $85,151 low. A close above the $89,350 resistance could further push the price higher. In the said case, the price could rise and test the $90,000 resistance. Any further gains could send the price towards the $91,200 level. The next hurdle for the bulls could be $92,000 and $92,500.
Another BTC crash?
If Bitcoin fails to rise above the $88,500 resistance zone, a new decline could begin. Current support is near the $87,000 level. The first major support is near the $86,500 level.
The next support is now near the $85,500 zone. Any further losses could send the price towards the $85,000 support in the near term. Major support is at $83,500, below which BTC could accelerate lower in the near term.
Technical indicators:
Hourly MACD – MACD is now losing ground in the bearish zone.
Hourly RSI (Relative Strength Index) – RSI for BTC/USD is now near the 50 level.
Major support levels – $85,500 and then $85,500.
Major resistance levels – $88,500 and $89,350.


